Blog
All of England's buses for an hour...
Posted on 15 Sept 2026 by Mark
Which road in England carries the most buses? We know there are some really good timetable processing tools and maps out there (GTFS-GO, Basemap DataCutter, BuildMoreBusLanes, to just name a few...). Often though they don't account for the true street network layout - a lot of visualisations are limited and hard to understand because they are just lines overlaid onto lines. So it's hard to understand how different roads and routes have different frequency - pretty important for buses :)
Network analysis tools, particularly the amazing OSMnx, have for a while made this kind of road network understanding a lot easier by automating some of the heavy lifting of connecting things like OpenStreetMap. But I couldn't find a good approach for the UK's bus timetables, which are published regularly by DfT in GTFS format. The idea came when a colleague mentioned 'can we draw a frequency map for [Redacted]shire' - and the answer is, kinda, if we want to spend a couple of days fiddling with GIS. I wondered if it was possible to do it for a really big region, once.
OSMnx and other network tools allow us to dispense with all but the most important bits of the timetable data, and just consider the connectivity between England's buses. The way it works separates bus routes from their geography, considering only the connnectivity in the road network, before then re-assigning to individual road links. This process looks at over 4 gigabytes of timetables, totalling 15 million stop-to-stop pairs for a chosen date in mid September (Tue 8th Sept - there is no such thing as a 'typical day' for timetabling purposes!).
Click below for the interactive map
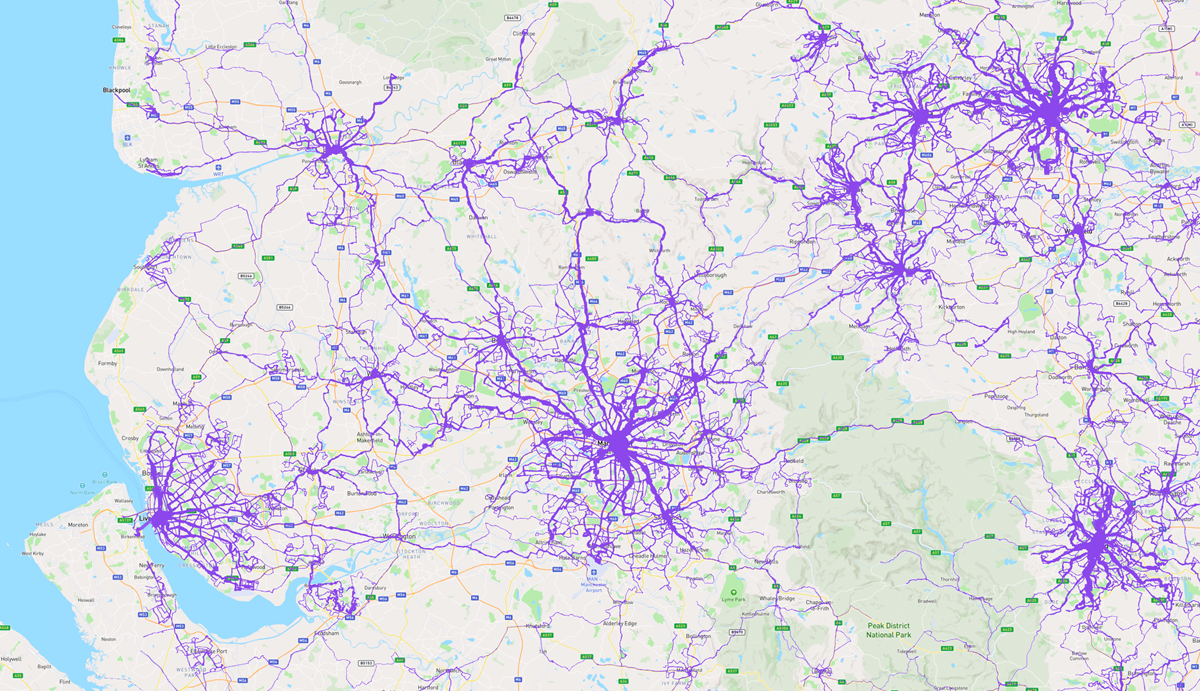 The result has a lot of quirks, being at the mercy of crowdsourced data and fiddly things like one-way systems and bus priority in dozens of city centres, but it's a great start! It intentionally doesn't try to visualise central London and rural Devon perfectly: as you might guess, they are pretty different in terms of service levels. If you want better maps of these places, hit me up!
If you spot any bits that don't look right (e.g. Cornwall?!?!) drop me a line - this was first-and-foremost a stress test for buses in OSMnx, especially using bleeding-edge newer features, and visualising of the outputs. But keen to keep making tweaks, especially if others find this script useful. I'd also like to open-source the script in due course, so anyone can use it, including outside the UK.
And the busiest road in the country, in bus terms? Carrington Street, here in Nottingham, has a healthy ~277 buses passing every hour, when you combine the two directions - partly so high because it's got several busy stops and buses passing through from other routes. Colston Avenue in Bristol (surely due a rename, but that's another discussion) has a similar number of buses passing every hour. There are others that are nearly as busy - let me know if you find them!